ISO 10816 Vibration Chart: Zones A, B, C, D Explained

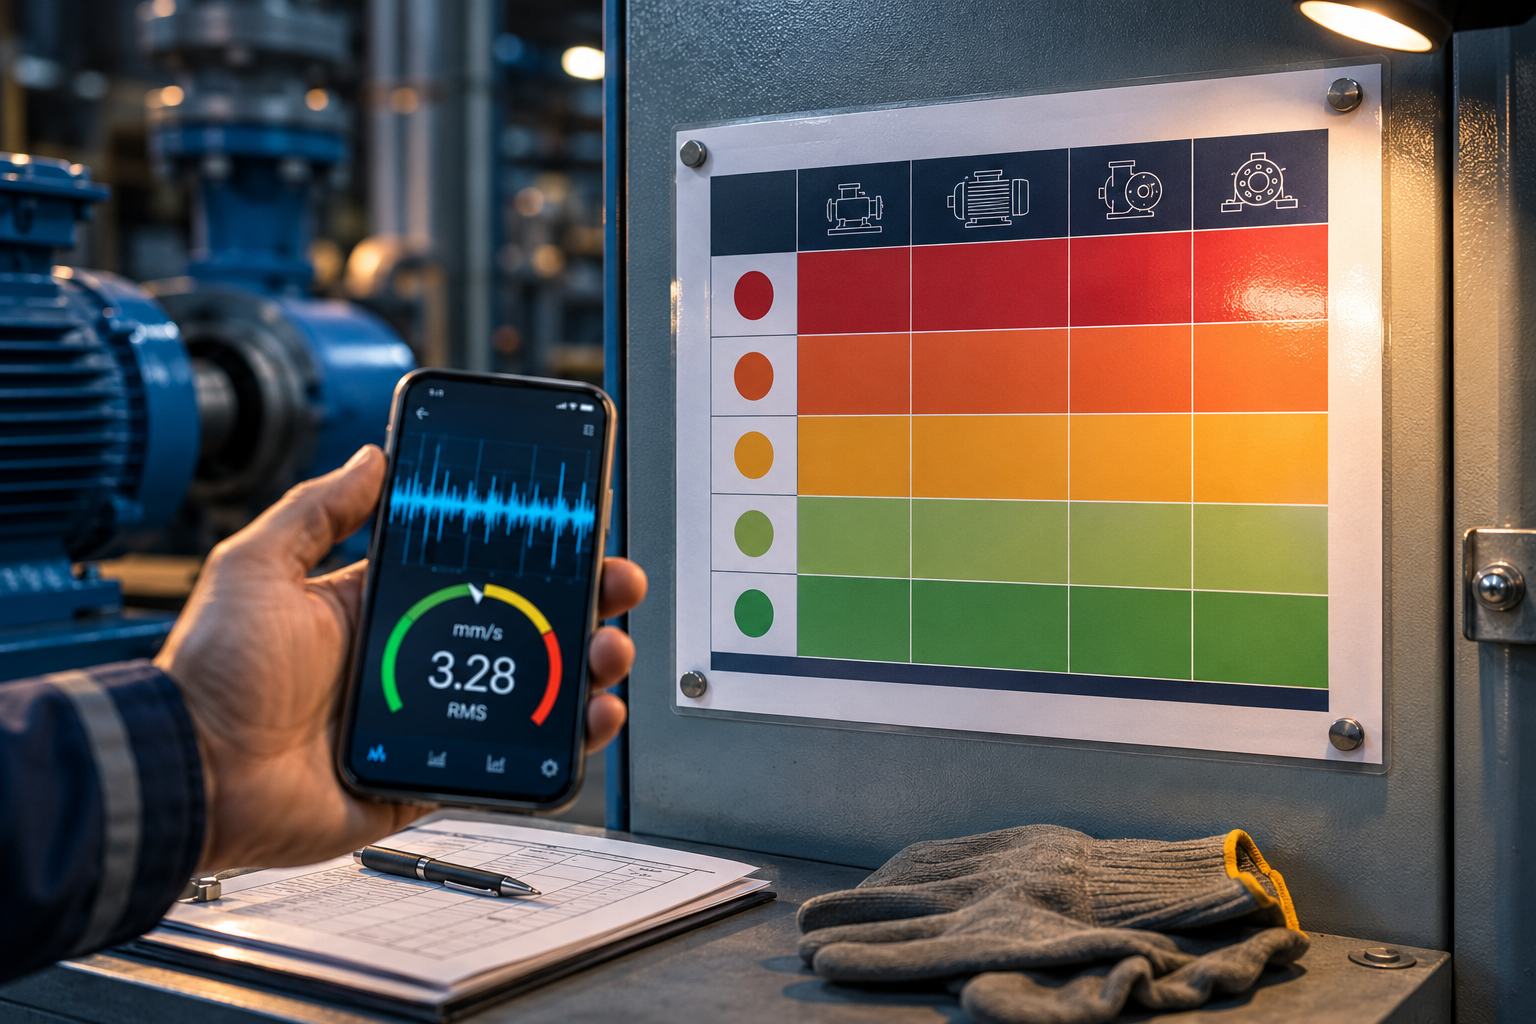
ISO 10816 Vibration Limits Chart & Severity Zones (A, B, C, D) Explained
The ISO 10816 vibration severity chart is the single most referenced tool in machine condition monitoring. It takes one number — your overall vibration in millimetres per second (mm/s RMS) — and turns it into a clear verdict: is this machine healthy, or is it heading for failure? The chart sorts every reading into one of four zones, labelled A, B, C and D, where A is like-new and D is dangerous.
This guide explains exactly what the chart shows, what each zone means, how the classic four-class “rainbow” severity chart differs from the modern ISO 10816-3 limits table, and how to read your own machine’s position on it. If you want the specific safe thresholds for individual machine types, our companion guide on acceptable vibration levels by equipment covers motors, pumps, fans and compressors in detail — here we focus on the chart itself.
Find your machine’s zone in seconds
Read your live mm/s RMS value, then match it to the zone tables below. No data collector needed — your iPhone’s accelerometer does the measuring.
What is the ISO 10816 vibration severity chart?
ISO 10816 is an international standard that defines how to measure and evaluate mechanical vibration on rotating machines using readings taken on the non-rotating parts — typically the bearing housings or machine feet. Its central output is a severity chart: a grid that maps measured vibration velocity against machine type and tells you which condition zone the machine is in.
The standard has a lineage worth knowing. The original ISO 2372 (1974) introduced the famous colour-banded severity chart with four machine classes. ISO 10816 later replaced it, splitting into parts (10816-1 through 10816-21) and refining the framework into machine groups with rigid or flexible supports. Today, ISO 20816 is gradually superseding 10816, but it keeps the same zone boundaries — so the chart you have used for decades is still valid. You can capture the live readings you need to use any of these charts with the Vibration Detector Sensor app.
Zone A, B, C and D meaning
The four zones are the heart of the chart. They do not just describe vibration magnitude — each one carries a specific maintenance decision. Here is what every zone means and the action it implies:
| Zone | Label | Meaning | Recommended action |
|---|---|---|---|
| A | Good / newly commissioned | Vibration typical of a new or freshly overhauled machine in excellent condition. | None. Record as your baseline. |
| B | Acceptable | Suitable for unrestricted long-term operation. Most healthy machines live here. | Continue normal monitoring. |
| C | Unsatisfactory | Not suitable for long-term running. Something is developing. | Investigate the cause; plan corrective maintenance. |
| D | Dangerous | Vibration severe enough to cause imminent damage. | Correct urgently; shut down if safe to do so. |
The key insight is that the zone, not the raw number, drives the decision. A reading of 3.0 mm/s might sit in Zone C on a small motor but comfortably in Zone B on a large turbine — which is why the chart adjusts its boundaries by machine type. Log the zone alongside the value every time you measure, and the app’s session history turns those single readings into a trend you can act on.
The classic vibration severity chart (Class I–IV)
When most people picture “the vibration severity chart,” they are thinking of the colour-banded ISO 2372 chart with four machine classes. It is still printed on shop walls everywhere because it is simple and fast to read. The four classes are:
- Class I — small machines, motors up to about 15 kW.
- Class II — medium machines, roughly 15–75 kW.
- Class III — large machines on rigid, heavy foundations.
- Class IV — large machines on flexible or soft foundations (e.g. turbomachinery).
Here are the RMS velocity boundaries (mm/s) for each class and quality grade:
| Machine class | Good (A) | Satisfactory (B) | Unsatisfactory (C) | Unacceptable (D) |
|---|---|---|---|---|
| Class I (≤15 kW) | ≤ 0.71 | 0.71–1.8 | 1.8–4.5 | > 4.5 |
| Class II (15–75 kW) | ≤ 1.12 | 1.12–2.8 | 2.8–7.1 | > 7.1 |
| Class III (large, rigid) | ≤ 1.8 | 1.8–4.5 | 4.5–11.2 | > 11.2 |
| Class IV (large, flexible) | ≤ 2.8 | 2.8–7.1 | 7.1–18 | > 18 |
Notice the pattern: as machines get bigger and their mounts more flexible, every threshold shifts upward. A large flexibly mounted machine is simply allowed to vibrate more before it is flagged. Whichever class your machine falls into, you read the live mm/s value from the sensor app and slot it into the right row.
The modern ISO 10816-3 limits chart (Groups 1 & 2)
ISO 10816-3 reorganised the classes into two groups based on power and split each by support type. The zone boundaries below are the modern equivalent of the classic chart and are what you will find cited in current condition-monitoring programs:
| Group & support | A/B (mm/s) | B/C (mm/s) | C/D (mm/s) |
|---|---|---|---|
| Group 2 (15–300 kW) — Rigid | 1.4 | 2.8 | 4.5 |
| Group 2 (15–300 kW) — Flexible | 2.3 | 4.5 | 7.1 |
| Group 1 (>300 kW) — Rigid | 2.3 | 4.5 | 7.1 |
| Group 1 (>300 kW) — Flexible | 3.5 | 7.1 | 11.0 |
Rigid vs. flexible support: A support is “rigid” if the machine’s lowest natural frequency is above its running speed, and “flexible” if it is below. In practice, machines bolted to a massive concrete block are usually rigid; those on spring isolators, steel frames or raised platforms are usually flexible.
How to read the chart: a worked example
Suppose you have a 90 kW electric motor bolted to a concrete foundation, and your reading is 3.6 mm/s RMS. Walk it through:
- Group? 90 kW falls in 15–300 kW → Group 2.
- Support? Concrete block → rigid.
- Boundaries (Group 2, rigid): A/B = 1.4, B/C = 2.8, C/D = 4.5.
- Verdict: 3.6 mm/s sits between 2.8 and 4.5 → Zone C, unsatisfactory. The machine can run short-term, but investigate now and plan a repair.
That single workflow — measure, identify group and support, read the zone — is all the chart asks of you. The measuring part takes seconds with a phone; you can grab the reading using the accelerometer-based vibration meter and immediately know which column to read.
Why the chart uses mm/s RMS velocity
The chart is built around overall RMS velocity rather than acceleration or displacement because velocity stays roughly constant across the frequency band where most machine faults appear, making a single threshold meaningful from low to mid frequencies. RMS — root mean square — captures the sustained energy of the vibration rather than an instantaneous spike, which correlates far better with fatigue and long-term damage. If your instrument reads in imperial units, remember 1 mm/s ≈ 0.03937 in/s. The Vibration Detector Sensor app shows RMS, peak and the live frequency spectrum so you can read the chart and then dig into the cause.
✓ Pro tip: The chart gives an absolute verdict, but trend matters just as much. A machine sitting steadily in Zone B is fine; a machine climbing from Zone A toward B over a month is telling you something is wearing. Log readings regularly so you catch the slope, not just the snapshot.
Turn your phone into a vibration severity meter
Live RMS & peak in mm/s, dominant-frequency spectrum, session logging and CSV export — everything you need to place any machine on the ISO chart and track it over time.
► Get Vibration Detector Sensor on the App Store | Explore the app →
Note: A smartphone accelerometer is well suited to screening, trending and learning the chart, but it is not a substitute for a certified, calibrated vibration analyser when compliance-grade acceptance measurements are required.
Frequently Asked Questions
What does Zone A, B, C and D mean on a vibration chart?
Zone A is good (newly commissioned condition), Zone B is acceptable for unrestricted long-term operation, Zone C is unsatisfactory (run only short-term while you plan repairs), and Zone D is dangerous and demands urgent corrective action. The mm/s value at each zone boundary changes with the machine’s size and support type.
What is the ISO 10816 standard for vibration?
ISO 10816 is an international standard for measuring and evaluating mechanical vibration of rotating machines by taking readings on non-rotating parts such as bearing housings. It defines severity zones (A–D) and the mm/s velocity limits that separate them, giving maintenance teams a common framework for go/no-go decisions.
What is the difference between ISO 2372 and ISO 10816?
ISO 2372 was the original 1974 standard that introduced the classic four-class severity chart. ISO 10816 replaced it, splitting the guidance into multiple parts and reorganising machines into groups with rigid or flexible supports while refining the zone boundaries. ISO 20816 is now gradually superseding 10816 but uses the same limits.
Is vibration severity measured in mm/s or inches per second?
Both are used. The ISO charts are defined in mm/s RMS velocity, common in most of the world, while North American programs often report inches per second. They are interchangeable: 1 mm/s is approximately 0.03937 in/s, so 4.5 mm/s equals roughly 0.18 in/s.
What vibration velocity falls into Zone D (dangerous)?
It depends on machine class. For a medium machine (Group 2) on a rigid mount, Zone D begins above 4.5 mm/s RMS. For large machines or flexibly mounted equipment, the dangerous threshold rises to roughly 7.1 mm/s or even 11 mm/s, because larger, softer-mounted machines tolerate more vibration.
Does every machine use the same vibration severity chart?
No. The general ISO 10816-3 chart covers most rotating machines, but several machine types have dedicated standards — pumps (10816-7), fans (14694), reciprocating compressors (10816-6) and gas turbines (10816-4), for example. Always match the machine to the correct part of the standard before judging its reading.
iso 10816 vibration limits chartvibration severity chartzone A B C D meaningiso 10816-3 zonesvibration velocity mm/s chartmachine vibration classesiso 2372 severity chartvibration condition zones