Golf Launch Monitor Glossary — Every Metric Explained Simply

Golf Launch Monitor Glossary — Every Metric Explained Simply
By Asaru Labs | Golf Education | 9 min read
The first time you see a launch monitor readout, it can feel like a dashboard full of numbers with no obvious meaning. Ball speed, smash factor, spin axis, descent angle — what does any of it actually tell you, and what should you do with it? This glossary explains every launch monitor metric in plain language: what it measures, what a good number looks like, and why it matters for your game.
All of these metrics are tracked by the Golf Launch Monitor app on every shot, directly from your iPhone camera — no hardware required.
See all these metrics on every shot — free.
The Golf Launch Monitor app tracks ball speed, club head speed, smash factor, launch angle, spin rate, carry distance, and shot dispersion from your iPhone camera — no extra hardware needed. Download free and start understanding your swing data today.
How to use this glossary
The metrics are organised into three groups in the order a shot unfolds:
- Impact metrics — what happens at the moment of contact between club and ball
- Launch metrics — how the ball leaves the face in the first fraction of a second
- Flight and outcome metrics — how the ball travels through the air and where it lands
Understanding how the groups relate to each other is just as important as understanding individual metrics. Impact conditions create launch conditions. Launch conditions determine flight and outcome. You cannot fix an outcome problem without understanding which impact or launch condition is causing it.
Part 1 — Impact metrics
These metrics describe what happens at the moment the clubface contacts the ball. They are the root cause of everything downstream.
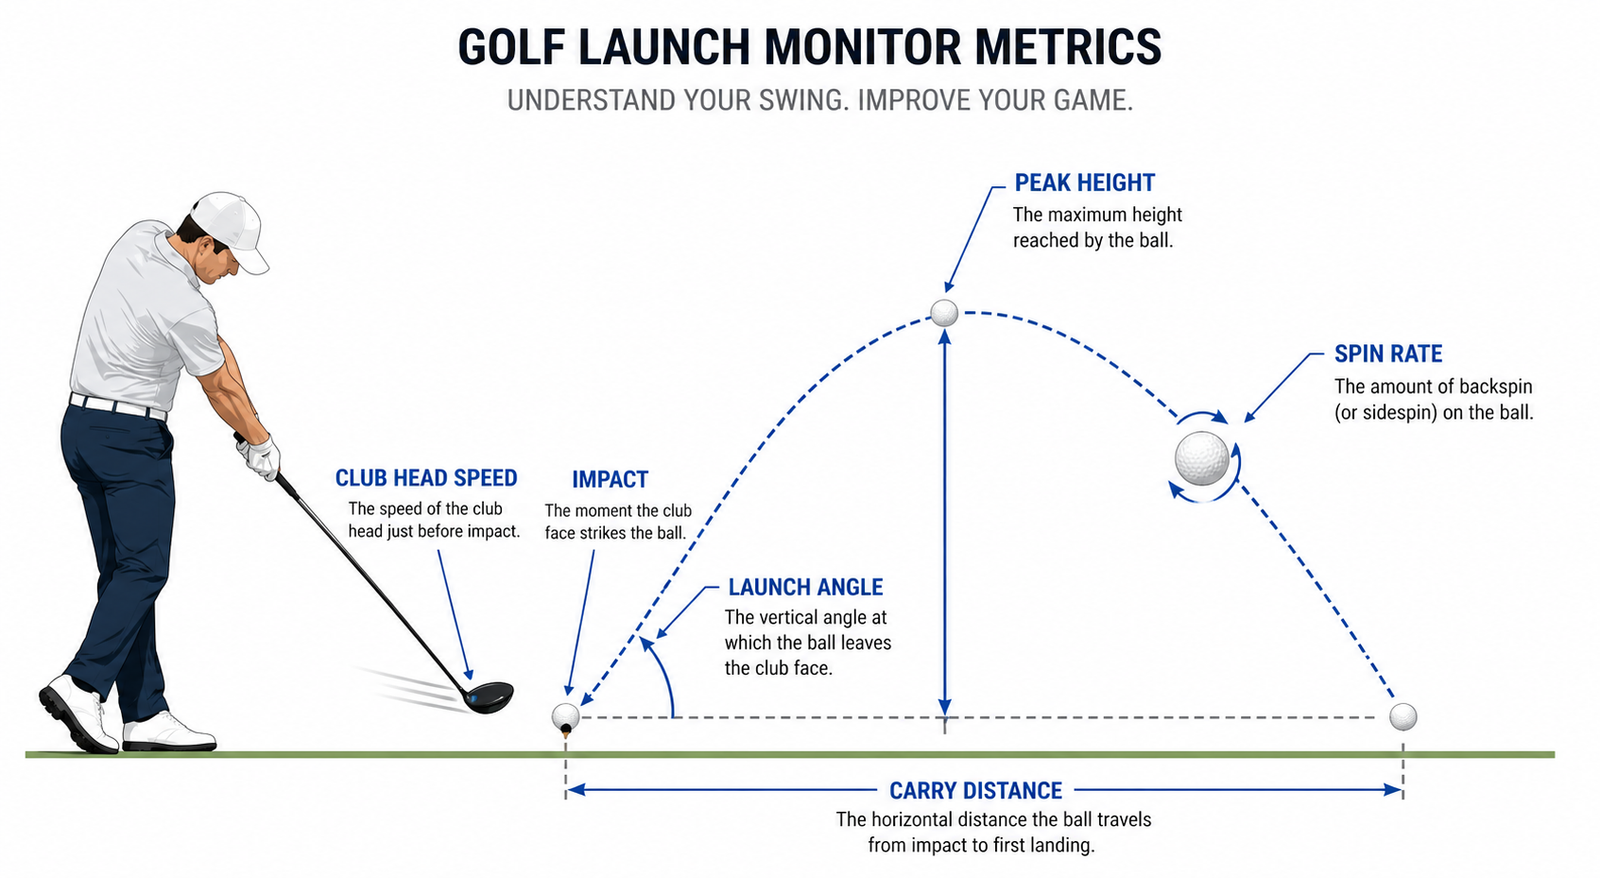
Club Head Speed
What it is: The velocity of the clubhead at the precise moment it makes contact with the ball, measured in miles per hour (mph).
What it tells you: Club head speed is the raw input of your swing — the engine that drives everything else. Higher club head speed means more potential energy to transfer to the ball. It is largely a function of your body's rotational speed, club length, and how efficiently you sequence your swing from feet through hips, torso, arms, and hands.
What good looks like:
| Player profile | Typical driver club head speed |
|---|---|
| Beginner / casual amateur | 70–85 mph |
| Mid-handicap amateur | 85–100 mph |
| Low handicap amateur | 100–112 mph |
| Tour professional | 113–125 mph |
Important nuance: Club head speed is potential, not outcome. A 100 mph swing that strikes the ball off-centre produces less distance than a 95 mph swing that strikes the dead centre of the face. Club head speed tells you your ceiling — smash factor and launch conditions determine how much of that ceiling you reach.
Ball Speed
What it is: The velocity of the golf ball immediately after leaving the clubface, measured in mph.
What it tells you: Ball speed is the single strongest predictor of carry distance. It is the output of the impact — the result of your swing speed combined with how efficiently you delivered the clubface to the ball. Every 1 mph of additional ball speed adds approximately 2 yards of carry distance with a driver.
What good looks like (driver):
| Club head speed | Good ball speed target |
|---|---|
| 80 mph | 115–118 mph |
| 90 mph | 130–134 mph |
| 100 mph | 144–148 mph |
| 110 mph | 158–163 mph |
Diagnostic use: If your ball speed is significantly below the target range for your club head speed, contact quality — not swing speed — is your distance problem. Improving how centred your strikes are will raise ball speed without any change to swing mechanics.
Smash Factor
What it is: Ball speed divided by club head speed. The formula is: Smash Factor = Ball Speed ÷ Club Head Speed.
What it tells you: Smash factor measures the efficiency of your energy transfer at impact — how much of your club head speed became ball speed. It is the single most direct indicator of contact quality. A smash factor of 1.50 (the legal maximum for a driver) means every 1 mph of club head speed produced 1.50 mph of ball speed — the most efficient transfer possible. Most amateur golfers produce 1.30–1.42.
What good looks like (driver):
- 1.48–1.50 — excellent, tour-level contact quality
- 1.44–1.48 — very good, solid amateur contact
- 1.40–1.44 — good, room to improve contact consistency
- Below 1.40 — contact quality is costing meaningful distance; prioritise this over swing speed
Important nuance: Smash factor decreases as club loft increases — a pitching wedge will never smash factor like a driver because more loft sends energy upward rather than forward. Compare your smash factor against the expected range for the specific club you are using, not against driver benchmarks.
Dynamic Loft
What it is: The actual loft of the clubface at the moment of impact — which is almost always different from the loft printed on the club.
What it tells you: Dynamic loft is the real loft being delivered, accounting for shaft lean, wrist position, and face angle at impact. A player with excessive forward shaft lean at impact delofts the club significantly — a 7-iron with 34° of static loft might only deliver 24° of dynamic loft. Conversely, a flippy release adds loft, turning that 7-iron into something delivering 40° or more.
Why it matters: Dynamic loft is the primary driver of both launch angle and spin rate. Understanding it explains most launch and spin problems.
Spin Loft
What it is: The difference between dynamic loft and angle of attack at impact.
What it tells you: Spin loft is the mathematical driver of backspin. The larger the spin loft, the more backspin is generated. This is why hitting down on a driver (negative angle of attack) with normal loft creates very high spin loft and too much backspin — the exact opposite of what maximises driver distance.
Practical use: You rarely see spin loft as a displayed metric — it is more of a concept that explains why your angle of attack and driver loft adjustments produce the spin rate changes they do.
Part 2 — Launch metrics
These metrics describe how the ball leaves the clubface in the fraction of a second after impact. They are produced by the impact conditions above and determine the ball's entire flight path.
Launch Angle
What it is: The vertical angle at which the ball leaves the clubface after impact, measured in degrees above horizontal. A launch angle of 0° would mean the ball travels perfectly flat. A launch angle of 90° would mean it shoots straight up.
What it tells you: Launch angle determines the shape of the ball's trajectory — how high it goes and at what point it begins descending. Combined with spin rate, it determines how efficiently your ball speed converts into carry distance. Too low a launch angle and the ball does not get airborne long enough to maximise carry. Too high and it balloons and loses forward momentum.
What good looks like (driver, by swing speed):
| Driver swing speed | Optimal launch angle |
|---|---|
| Under 85 mph | 14°–17° |
| 85–95 mph | 12°–15° |
| 95–105 mph | 11°–14° |
| 105–115 mph | 10°–13° |
Common faults: Most amateur golfers launch the driver too low (8°–10°) due to a downward angle of attack. The fix is usually raising tee height and moving the ball forward in the stance to promote a slightly upward strike.
Spin Rate
What it is: The number of times the golf ball rotates per minute after leaving the clubface, measured in rpm (revolutions per minute). With a driver, this is primarily backspin. With irons, backspin helps the ball stop on greens.
What it tells you: Spin rate works together with launch angle to determine ball flight. The right spin rate keeps the ball stable and airborne on an efficient arc. Too much spin causes the ball to climb steeply, stall, and fall short of its potential carry. Too little spin produces a low, knuckling flight that drops out of the air early.
What good looks like (driver, by swing speed):
| Driver swing speed | Optimal spin rate | High spin (losing distance) |
|---|---|---|
| Under 85 mph | 2,400–3,000 rpm | Above 3,400 rpm |
| 85–95 mph | 2,200–2,800 rpm | Above 3,200 rpm |
| 95–105 mph | 2,000–2,600 rpm | Above 3,000 rpm |
| 105–115 mph | 1,800–2,400 rpm | Above 2,800 rpm |
Common fault: High driver spin from a downward angle of attack. A golfer at 95 mph with 3,400 rpm of spin can easily be carrying 20–25 yards less than the same swing with 2,200 rpm of spin. Raising tee height and shallowing the angle of attack are the primary fixes.
Spin Axis
What it is: The tilt angle of the axis around which the ball spins, measured in degrees. A perfectly level spin axis (0°) produces a straight ball flight. A negative (left) tilt produces a draw for a right-handed golfer. A positive (right) tilt produces a fade.
What it tells you: Spin axis is what makes the ball curve left or right. It is created primarily by the combination of clubface angle and swing path at impact — specifically, the difference between them (face-to-path relationship). A face open relative to the swing path creates a positive spin axis and a fade. A face closed relative to path creates a negative spin axis and a draw.
Practical use: If your spin axis is consistently strongly positive (above +4°) you are hitting a fade or slice. Strongly negative (below -4°) and you are drawing or hooking. Understanding your typical spin axis helps you aim correctly for your natural shot shape rather than fighting it on every hole.
Launch Direction
What it is: The horizontal angle at which the ball starts its flight, measured in degrees left or right of the target line. Negative values indicate left of target (for right-handed golfers), positive values indicate right.
What it tells you: Launch direction is determined primarily by face angle at impact — roughly 75–85% of where the ball starts its flight comes from face direction. It tells you whether your clubface is pointing at, left of, or right of your target at impact, regardless of your swing path.
Why it matters: A consistent launch direction off your target line tells you there is a systematic face angle issue — your grip, alignment, or release is consistently presenting the face open or closed. An inconsistent launch direction that varies wildly left and right suggests contact location variability or an inconsistent release pattern.
Part 3 — Flight and outcome metrics
These metrics describe the ball's journey through the air and its final landing position. They are the result of everything above — you cannot improve them directly, only by improving the impact and launch conditions that produce them.
Carry Distance
What it is: How far the ball travels through the air before making first contact with the ground, measured in yards. This does not include any roll after landing.
What it tells you: Carry distance is the most practically useful metric for course management. When you are planning a shot over a bunker, water, or any hazard, only carry distance matters — total distance including roll is irrelevant. It is also the number you should use when selecting a club for any approach shot, because your GPS or rangefinder is giving you the distance to a specific point, not a bounce-and-roll target.
Common mistake: Most golfers overestimate their carry distance by 10–20 yards because they measure total distance (including roll) on flat range surfaces, or because they remember their best shots rather than their average. The Golf Launch Monitor app measures carry directly and accurately, giving you the real number rather than the aspirational one.
Total Distance
What it is: Carry distance plus the roll distance after the ball lands, measured in yards. This is the full distance the ball travels from impact to final resting position.
What it tells you: Total distance is useful for understanding how much roll you are getting from your ball flight — which is influenced by landing angle, spin rate, and ground conditions. A ball with low spin lands at a shallower angle and runs further. A ball with high spin lands more steeply and stops quicker.
When to use it: Total distance is relevant for drives on firm, running fairways where the run-out contributes meaningfully to position. For approach shots to greens or any shot requiring a carry over a hazard, always plan using carry distance only.
Peak Height (Apex)
What it is: The maximum height the ball reaches during its flight, measured in yards or feet above the ground.
What it tells you: Peak height is a direct consequence of launch angle and spin rate. It tells you whether your ball is flying on an efficient arc or either punching too low through the air (insufficient carry potential) or floating too high and losing forward momentum.
What good looks like: For a driver, a peak height of 25–35 yards is a reasonable range for most amateur golfers. Very high peak height (above 40 yards) with a driver often signals excessive spin. Very low peak height (below 18 yards) suggests too low a launch angle or insufficient spin to sustain the flight.
Descent Angle
What it is: The angle at which the ball is descending when it lands, measured in degrees below horizontal.
What it tells you: Descent angle determines how the ball behaves when it lands. A steep descent angle (above 45°) means the ball stops quickly after landing — useful for approach shots to greens, especially into firm greens or shots over trouble. A shallow descent angle (below 25°) means the ball lands running and is difficult to stop on a green.
Practical use: Wedge shots typically descend at 40–50°, which is why they stop well on greens. Driver shots descend at 20–30°, which is why they run after landing. Understanding your descent angle helps you predict and plan for ball behaviour on landing rather than being surprised by it.
Hang Time
What it is: The total time the ball spends in the air from impact to landing, measured in seconds.
What it tells you: Hang time is primarily an indicator of launch angle and peak height. A ball that spends more time in the air tends to carry further (up to a point) and also gives more time for crosswinds to affect the flight. Hang time is rarely a direct action metric — you do not work on improving hang time directly — but it is a useful cross-check on whether your launch conditions are producing an efficient flight arc.
Shot Dispersion
What it is: The spread of landing positions produced by a series of shots hit with the same club at the same target, typically visualised as an oval pattern showing lateral spread (left-right) and distance spread (short-long).
What it tells you: Shot dispersion is the consistency metric — it measures not just where your average shot goes but how much your shots vary around that average. A tight dispersion pattern means you can predict where your shots will land with reasonable confidence. A wide, scattered pattern means even well-struck shots may end up far from the intended target.
What good looks like (7-iron):
| Handicap level | Typical lateral spread |
|---|---|
| Scratch | 10–18 yards |
| 5–10 handicap | 22–30 yards |
| 10–18 handicap | 35–50 yards |
| 18–28 handicap | 50–70+ yards |
Practical use: Knowing your real dispersion pattern for each club is one of the most valuable pieces of information you can bring to the course. It tells you which targets are realistic to aim at, and which are taking on more risk than your pattern supports — regardless of how well you think you are swinging.
How the metrics connect: the cause-and-effect chain
The most important thing to understand about launch monitor metrics is that they form a cause-and-effect chain, not a list of independent numbers. Every outcome metric traces back to an impact condition through the launch conditions in between.
The chain:
Impact conditions (club head speed, smash factor, dynamic loft, spin loft) → produce → Launch conditions (launch angle, spin rate, spin axis, launch direction) → produce → Outcome (carry distance, total distance, peak height, descent angle, dispersion)
This means that when something goes wrong at the outcome level — your carry distance is short, your shots are ballooning, your dispersion is wide — the fix is never at the outcome level. You have to trace back up the chain to find which impact or launch condition is producing the outcome you do not want, and fix that instead.
For example: short carry distance (outcome) is most commonly caused by excessive spin rate (launch) which is most commonly caused by a steep, downward angle of attack (impact). Fixing the carry distance means fixing the angle of attack — not trying harder to hit the ball further.
The Golf Launch Monitor app shows you every level of this chain simultaneously on every shot, which is what makes data-driven practice so much more efficient than feel-based practice — you can see exactly where in the chain the problem is, rather than guessing.
Quick reference: the metrics that matter most by goal
| If your goal is… | Watch these metrics | The question to ask |
|---|---|---|
| Hit the driver further | Smash factor, launch angle, spin rate, carry distance | Is smash factor above 1.44? Is launch angle in my optimal window? Is spin rate below 3,000 rpm at my speed? |
| Know my real club distances | Carry distance, smash factor variance | What is my average carry (not best or total) for each club? How consistent is my smash factor between shots? |
| Hit straighter shots | Shot dispersion, spin axis, launch direction | Is my miss pattern one-sided (face angle issue) or both sides (path variability)? What is my average spin axis? |
| Lower my scores | Carry distance, shot dispersion | Do I know my real carry distances for every club? Am I aiming at targets my dispersion pattern actually supports? |
| Fix high spin / ballooning shots | Spin rate, launch angle, peak height | Is my spin rate above the optimal range for my speed? Is it high because of a steep attack angle or low-face contact? |
See every one of these metrics on your next shot — free.
The Golf Launch Monitor app tracks the full set of metrics in this glossary on every shot — ball speed, club head speed, smash factor, launch angle, spin rate, spin axis, carry distance, peak height, and shot dispersion — straight from your iPhone camera, no hardware needed.
Frequently asked questions
What does launch angle mean in golf?
Launch angle is the vertical angle at which the ball leaves the clubface after impact, measured in degrees above horizontal. The optimal driver launch angle for most amateur golfers is between 12° and 15°, with slower swingers needing slightly higher launch (14°–17°) and faster swingers benefiting from a slightly lower, more penetrating launch (10°–13°). The Golf Launch Monitor app measures your launch angle on every shot.
What is spin rate in golf?
Spin rate is how many times the golf ball rotates per minute after leaving the clubface, measured in rpm. For a driver, the optimal spin rate for most amateur golfers is between 2,000 and 2,800 rpm depending on swing speed. Too much spin (above 3,200 rpm at average amateur speeds) causes the ball to balloon and fall short. Too little spin produces a low, knuckling flight that also loses carry.
What is ball speed in golf?
Ball speed is the velocity of the golf ball immediately after it leaves the clubface, measured in mph. It is the single strongest predictor of carry distance — every 1 mph of additional ball speed adds approximately 2 yards of carry with a driver. A male amateur golfer with a 90 mph club head speed should target a ball speed of around 130–134 mph for good contact quality.
What is smash factor in golf?
Smash factor is ball speed divided by club head speed. It measures how efficiently your swing speed is converted into ball speed at impact — essentially, how well you are making contact. The maximum for a legal driver is approximately 1.50. Most amateur golfers produce between 1.30 and 1.42. A smash factor below 1.40 means contact quality is costing you meaningful distance and should be addressed before working on swing speed.
What is carry distance vs total distance in golf?
Carry distance is how far the ball flies through the air before landing. Total distance includes carry plus the roll after landing. For course management — particularly any shot requiring a carry over a bunker, water, or hazard — only carry distance matters. Most golfers overestimate their carry by 10–20 yards because they measure total distance on flat ranges or remember their best shots rather than their averages.
What is shot dispersion in golf?
Shot dispersion is the spread of landing positions when you hit multiple shots with the same club at the same target. It is usually shown as an oval pattern — the wider the oval, the less consistent your shots. A typical mid-handicap golfer's 7-iron dispersion is 35–50 yards wide laterally. Tightening your dispersion pattern — rather than hitting it further — is often the fastest path to lower scores for golfers above a 10 handicap.
golf launch monitor glossarywhat does launch angle meanwhat is spin rate golfball speed definition golfsmash factor definitioncarry distance golf meaninggolf launch monitor metrics explainedclub head speed definition golf